Dashboard A12 'Slim Reizen' (travel smart)

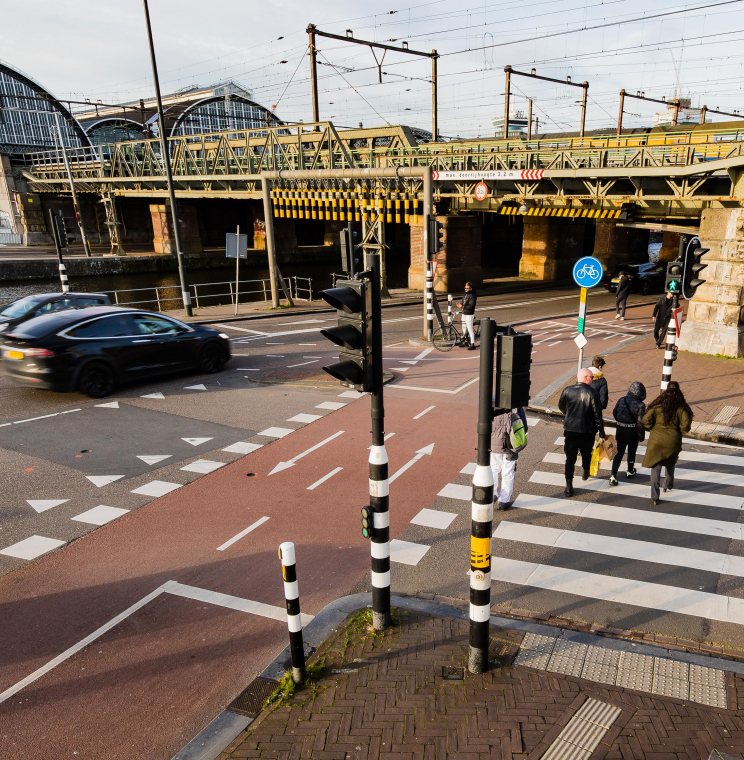
The roads around Arnhem (a city in the east of The Netherlands) are getting busier and busier. In particular, the Arnhem-German border (A12) section is regularly jammed. That is why the programme A12 Slim Reizen (travel smart) was started. Our help was called in to monitor the progress of this programme.
About the programme A12 Travel Smart
The programme A12 Smart Travel is part of Slim & Schoon Onderweg, the regional programme for a cleaner and better accessible Green Metropolitan Region Arnhem-Nijmegen. Within the programme A12 Travel Smart, the business community, authorities and educational institutions from the A12 region work together to stimulate travelling differently on the A12.
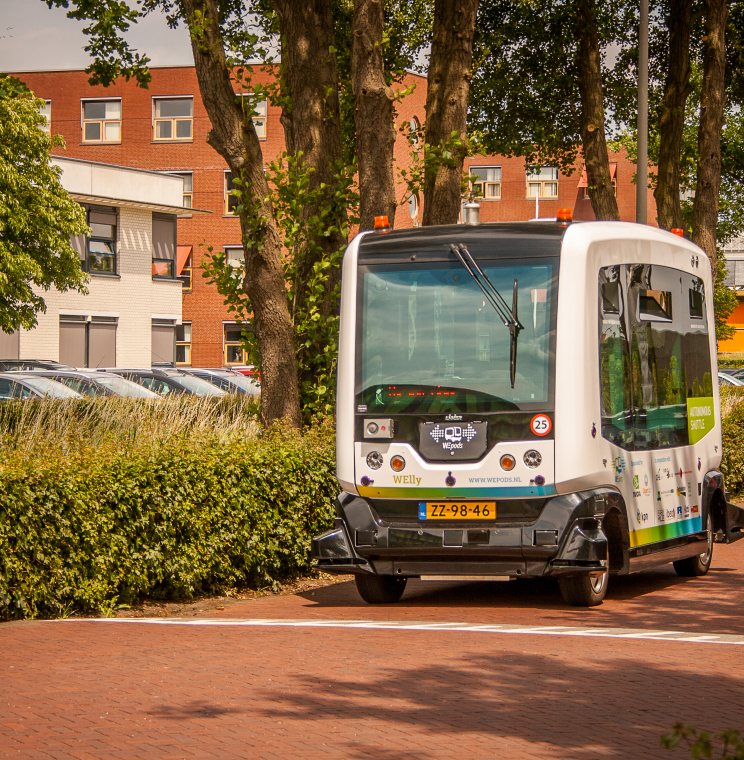
The programme helps travellers and companies to find smart alternatives for their routes to work, study, clients, shops and recreation. Examples include promoting bicycle use with bicycle competitions, using a logistics broker to plan supplies more efficiently and approaching companies via a mobility broker to change employees' travel behaviour.
What have we done?
Monitoring and evaluation are indispensable for developing and adjusting policy. It is important to know whether measures taken are having the desired effect and whether adjustments are required. This also applies to this project. In order to permanently improve the situation on the A12, it is important to monitor the progress of the programme. Therefore Goudappel has created a dashboard for the programme team. This dashboard shows the most important developments within the programme A12 Smart Travel.
Within this dashboard we use various data sources and translate the data from these sources into concrete information. Unique is the variety of sources that together tell a story. We do not only focus on important transport flows in the study area, but on the entire progress of the project.
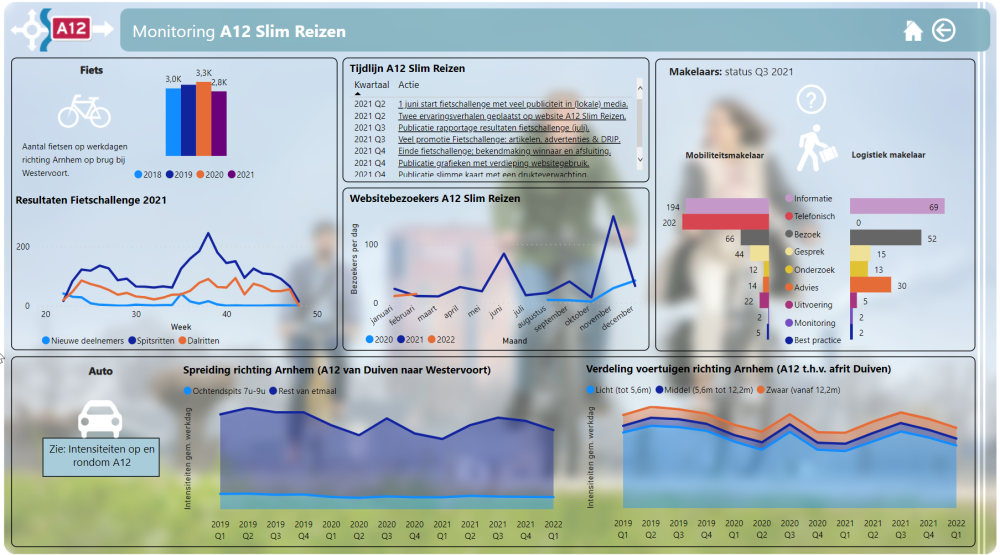
Impression of the dashboard we made for A12 Slim Reizen
Data sources in the dashboard
Examples of data sources we use in the dashboard:
- website visit figures
- traffic counts
- ov-chipcard data (travel pass for public transport)
- participants in bicycle actions
- activities of mobility brokers
What is the result?
The concrete result of this project is a dashboard that tracks the progress of the A12 Smart Travel project. This makes this project a good example of the importance of monitoring and evaluation when it comes to policy.
The project team responded enthusiastically to the dashboard and uses its contents to make informed policy decisions. The dashboard will be updated monthly until the end of 2022.
Client: Rijkswaterstaat
Year: 2021
Involved in this project: Dirk van Amelsfort | Nico Dogterom
Involved advisors
-
Hannah van Amelsfort
policy and behavioural research consultant